Introduction
Open this page on GitHub Pages |
View the repository |
|
![]()
This repository contains various JavaScript based visualisations that can be used with the JSViz extension.
The philosophy behind these visualisations is to make them simple to use and configure - a user shouldn’t need to understand JavaScript, HTML, JSON or CSS in order to make use of the charts.
This is achieved (as far as possible) through the following common features:
- Each visualisation builds to a single minified JavaScript file containing all dependencies. Adding the visual to JSViz is then a simple case of adding one JavaScript reference, as opposed to adding D3.js, JQuery etc. independently.
- Each visualisation allows for configuration within Spotfire Analyst using a form generated through JQueryUI, rather than requiring the user to write any JavaScript or enter JSON data.
- The visualisations automatically load and render when added to JSViz - again there’s no need to write any HTML, JavaScript etc.
- Visualisations attempt to respond to Spotfire themes, removing the need to edit CSS.
- Where possible, the visualisations support standard Spotfire functionality such as marking data, showing tooltips, legends and labels.
Secondarily, effort has been placed into making the development process as simple as possible:
- A test harness has been created that supports testing responses to marking events, theming etc.
- Helper scripts handle all the configuration interaction, dealing with common marking scenarios etc.
- Build scripts have been created to automate the creation of minified packed versions of the visualisation scripts.
Using the visualisations
Example Spotfire files demonstrating use of the visualisations can be found here
Available visualisations
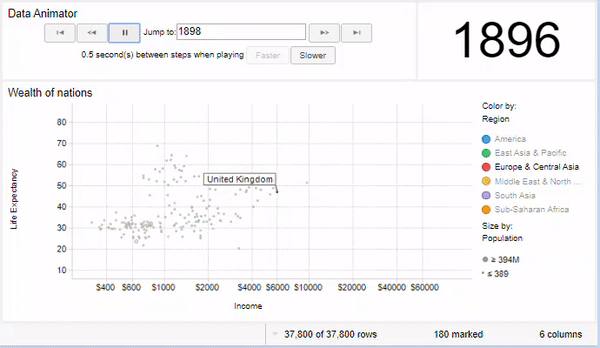
The data animation custom visualisation can help you animate charts on a page by changing data markings automatically. This link opens a live ‘demo’ using our test harness (i.e. without Spotfire).
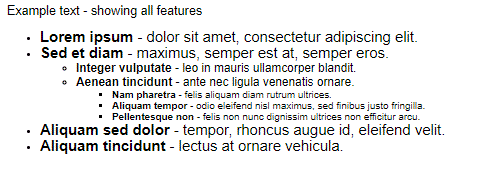
The Bulleted Lists visualisation allows you to create lists that look like PowerPoint slides containing text. This link opens a live ‘demo’ using our test harness (i.e. without Spotfire).
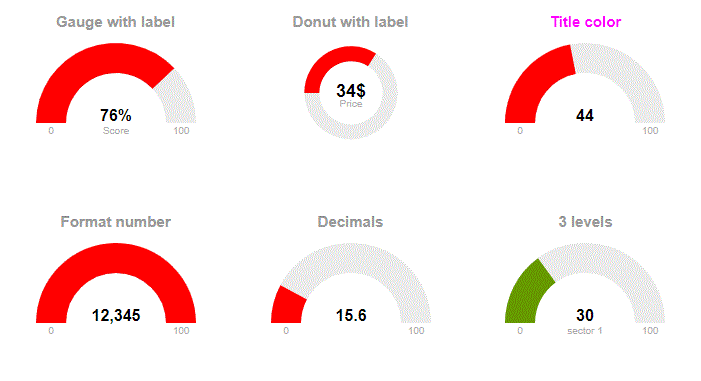
Gauges and Donuts allow visualisation of a single value using a gauge style presentation. This link opens a live ‘demo’ using our test harness (i.e. without Spotfire).
The image viewer shows images from URLs in a simple fashion. This link opens a live ‘demo’ using our test harness (i.e. without Spotfire).
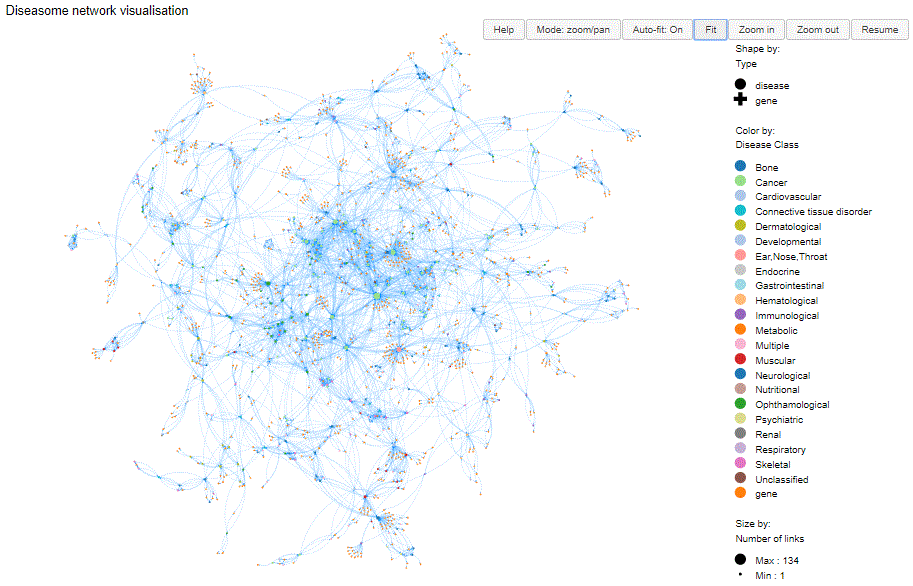
Force-directed graph visualisations (network charts) are useful for visualising relationships between entities (the example below shows relationships between genes and diseases). This link opens a live ‘demo’ using our test harness (i.e. without Spotfire).
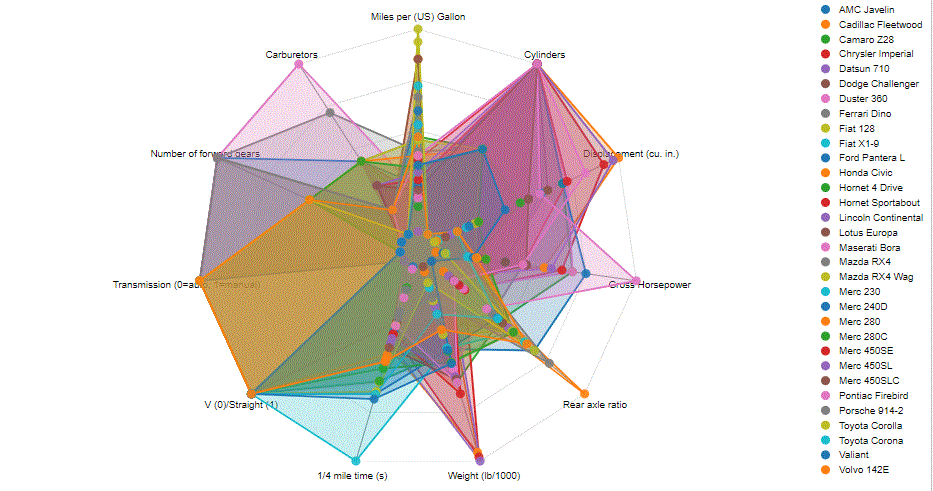
Radar charts (sometimes called Spider Plots) show attributes of items in a radial fashion. This link opens a live ‘demo’ using our test harness (i.e. without Spotfire).
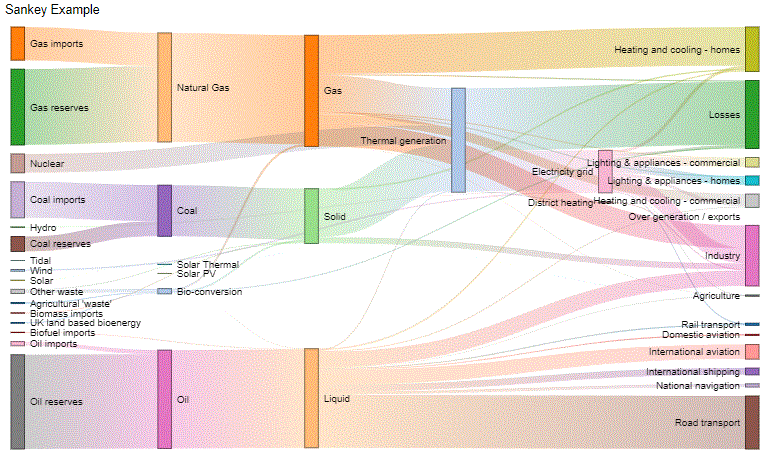
A Sankey chart is a type of flow diagram, in which the width of the arrows is shown proportionally to the flow quantity. It is useful to show directional relationships between entities (i.e. where a value ‘v’ moves from ‘a’ to ‘b’). Common examples include the representation of conversion of energy from one form to another, the loss of some item during a multi-step process, the flow of money between entities or the flow of users through a web site. It can also be used to show the linkage between two types of entity (by using one entity for ‘from’ and the other for ‘to’) - e.g. the commonality between review scoring by two different reviewers. This link opens a live ‘demo’ using our test harness (i.e. without Spotfire).
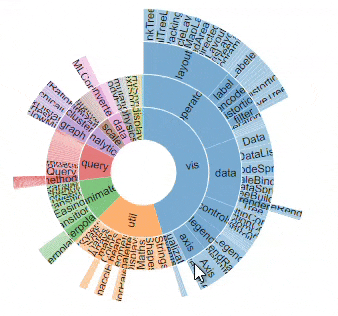
A Sunburst chart shows hierarchical data in a multi-level Pie chart. The chart can be configured to show all levels of the hierarchy, or to allow a user to zoom up and down the hierarchy. This link opens a live ‘demo’ using our test harness (i.e. without Spotfire).
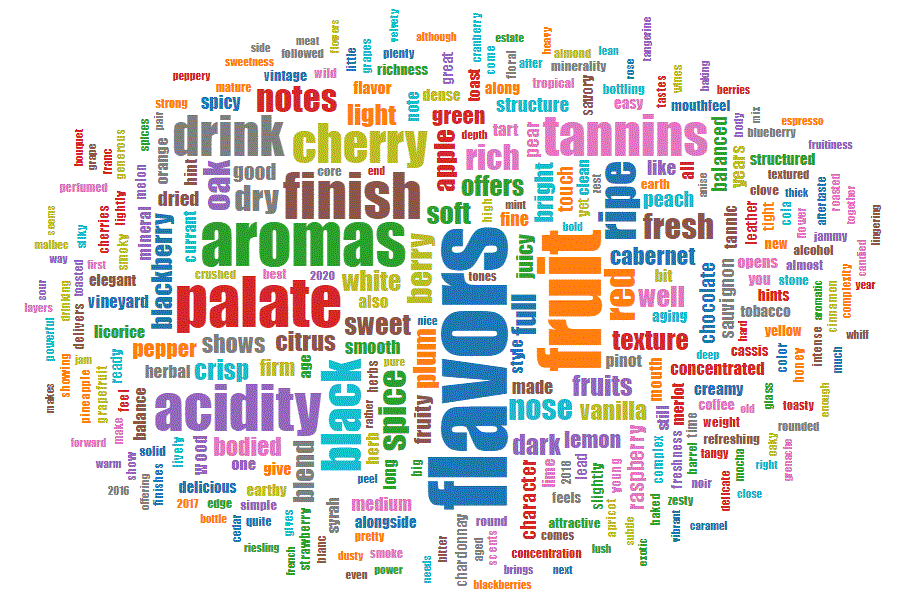
Word clouds are often used to show how often specific words or phrases appear in a dataset. They can also be used for simple presentation reasons (e.g. to show a list of recent achievements). This link opens a live ‘demo’ using our test harness (i.e. without Spotfire).
Writing ‘simple’ JavaScript using the library
It is also easy to write one-off custom visuals using the framework on top of JSViz. The ‘JSVizHelper’ can be loaded as a script into the JSViz visualisation, providing a simpler API than JSViz itself, along with automatic inclusion of JQuery and JQuery UI.
Developing
- You’ll require Node.js and npm (usually installed with Node.js)
- From command line execute ‘npm install’ to install command line utilities for testing.
- Run ‘npm run build:dev’ from a command line to set up the build process which will automatically update the files in the /dist folder when source files are edited. Any syntax errors or lint failures will be displayed by the build command line.
- Test using test harnesses within a browser - they will render the version of the visual from the /dist folder.
- This repository contains configuration files for Visual Studio Code to add tasks for running the builds or executing the test harnesses in Chrome.
Adding a visualisation
- Create new JavaScript file in the visuals folder. At a minimum reference the JSVizHelper and implement call to the SetupViz method - which will require code for rendering.
- Create new test harness HTML in the Test Harness folder
- Update webpack-config/base.js to include a new “entry” value for the new file.
Features of the test harnesses
- Automatically creates DOM elements to house the visualisation - the wrapper HTML script can be very simple.
- Captures any requests that would normally be sent to the Spotfire servers and writes them to the JavaScript console.
- Handles marking requests that would normally be sent to the server and responds by causing the visualisation to re-render with the appropriate rows marked.
- Adds a button that simulates switching between light and dark Spotfire themes.
- Adds a button that simulates enabling/disabling the legend.
- Adds a button that randomises the data being sent to the visualisation (detects any numeric columns and places random values into them).
- Adds a button to test sending an empty dataset to the visualisation.
- Adds buttons to simulate filtering the data and to restore the original data.
Features of JSVizHelper
- Supports common marking scenarios automatically. It can mark based on clicks/drags on SVG or HTML elements - simply assign a data-id attribute on each element that contains the row’s index hint value.
- Breaks the flow of rendering into ‘firstTimeSetup’ (intended for creation of elements) and ‘render’ to actually render data. The ‘render’ method may be called multiple times if the data changes (e.g. marking, filtering, changing configuration).
- Provides configuration forms that can be accessed from within Spotfire Analyst.
JSVizHelper API reference
Setting up a visualisation
The main entry point to the helper is the SetupViz method:
// Configure using an options object
JSVizHelper.SetupViz(options)

// Simple example which will call a function when rendering is required
JSVizHelper.SetupViz({ render: function( data, config ) {
    // Do something with the data
}})
The options object must at a minimum provide rendering function(s), but can also provide options to control marking and a configuration form.
Options
defaultConfig- an object that contains defaults for any configuration parameters. JSVizHelper will combine this with any configuration sent from Spotfire - thus this can be used to ensure that theconfigobject always contains values for expected properties.
configButton- Specifies where the configuration button should appear - either configButton.textLeft or configButton.gearRight (defaults to textLeft)
render- A function that will be called when the visualisation is to be rendered, parameters are the data from spotfire and a configuration object where the default has been combined with the values from Spotfire.
firstTimeSetup- A function that will be called the first time a visualisation is to be rendered, same parameters as render. Use this function to do things that only need to happen once and do not change with the data - e.g. creation of static elements in the DOM.
renderOnResize- true to indicate that the render method should be called whenever the window is resized. Sometimes it is possible to create visuals that resize automatically when the window is resized, but if the rendering algorithm relies on the window size we can set this flag to force the render function to be called.
mark- Either a function that conforms to the JSViz markModel signature, or an object defining selection using one of the helper approaches. The object should be of the form{ selector: <jQuery selector for objects of interest>, type: <the algorithm>, ignoreClicks: <ignore click events for marking>, callback: <callback function> }. The helper approaches rely on finding elements in the DOM which contain a ‘data-id’ attribute which matches the ‘row hint’ from the Spotfire data. Available algorithms are:
JSVizHelper.markType.rect- Simple HTML rectangle intersection - selector identifies all elements that will be checked for rectangle intersection.JSVizHelper.markType.svg- SVG intersection detection (deals with any shape) - selector should be the svg element itself - note that there is a webkit bug meaning that Safari and Chrome match based on bounding boxes rather than on the actual drawing content.JSVizHelper.markType.callback- The callback function will receive the marking mode and the rectangle for marking.
configuratorTitle- The title shown when the configurator dialog is shown
configuratorInstructions- Instructions shown in the configurator dialog
configOptions- An array of objects defining the various configuration options to be displayed on the configuration form. Each property has a datatype and caption which dictate the way that the user is prompted. The following attributes of a property are supported:
caption- The user visible caption on the form.
type- One of ‘checkbox’, ‘color’, ‘select’, ‘column’ or a valid type for an<input>element (e.g. ‘text’, ‘number’). The ‘color’ type uses a built-in colour picker, the ‘column’ type uses a select menu with all the column names found in the Spotfire data.
name- The property name - configuration can be referenced asconfig.<name>in the render function.
inputAttributes- these attributes will be assigned to the<input>element used for prompting, thus any valid attribute is supported (e.g. min/max for number inputs).
options- an array of options when using a type of ‘select’. Each option should have a ‘value’ and a ‘text’ attribute.
valueIfChecked/valueIfUnchecked- values to use for checkbox type prompts.
tab- the name of the tab within the form (supporting multi-tab forms).
enabledIfChecked/disabledIfChecked- These can be used to enable/disable prompts based on whether other properties have been checked/unchecked, simply specify the name of the property as the value for these attributes.
Simplifying the data array
The DataAsNamedArray method allows data from Spotfire to be reorganised into a form more likely to be handled by libraries such as D3. The output from the function
is an array of rows, with each row containing an object whose properties are the columns of data from Spotfire.
var includeSpecialColumns=true
var newData = JSVizHelper.DataAsNamedArray(data, includeSpecialColumns)
newData.forEach(function(row, index) {
    // Do something with the row, e.g.
    var val = row.MyColumn
    var rowIndex = row[JSVizHelper.DataIndexColumn]
    var isMarked = row[JSVizHelper.DataMarkedColumn]
})
Busy/idle support
Call the pushBusy function whenever you start being busy and popBusy when the associated activity completes.
The functions optionally take a parameter allowing specific operations to be tracked - you can push the same activity as many times as you like, but popping it will clear the busy indicator for that activity immediately. Hence we support simple push/pop with counting (e.g. when creating lots of transitions - push when each starts, pop when each ends) or push/pop of specific actions. We’ll track when to call the setBusy function - we’ll only clear the busy flag once all activities are completed.
By default, the render method automatically pushes and pops an activity - so there’s no need to call these methods unless more complex handling is required (e.g. animations)
JSVizHelper.pushBusy('some activity identifier')
window.onTimeout(100, function() {
  // A real example might use this to tell Spotfire that we're busy with an animation so wait until it completes before rendering any images for export
  JSVizHelper.popBusy('some activity identifier')
})
Helpers for showing messages instead of charts
Sometimes we may want to display a message instead of the actual chart - e.g. a message when there is no data to show
// Show a message instead of the visualisation
JSVizHelper.showMessageInstead("No data to show")
// Hide the message and allow the chart to show
JSVizHelper.hideMessage()
Easy example
Take a look at /visuals/JSVizImageViewer.js - this visualisation simply renders images based on URLs in the data.